FL Chart (Pie Charts) - Flutter Package Deep Dive
- Joseph Muller III

- Jan 25, 2021
- 2 min read
Let's get straight to the point: charts make everything better. Without them, dashboards are dull and progress reports are word walls. In this article I'll be exploring the fl_chart Flutter package and how it can be used to make some of the best darn pie charts you've ever seen.
Create A Pie Chart
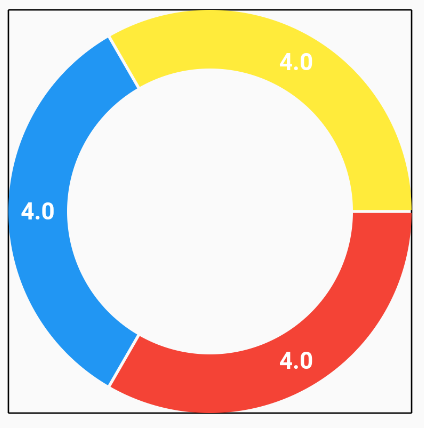
We'll start off slow. The values determine how much each section takes up.
PieChart(
  PieChartData(sections: [
    PieChartSectionData(color: Colors.red, value: 4),
    PieChartSectionData(color: Colors.blue, value: 4),
    PieChartSectionData(color: Colors.yellow, value: 4),
  ]),
)
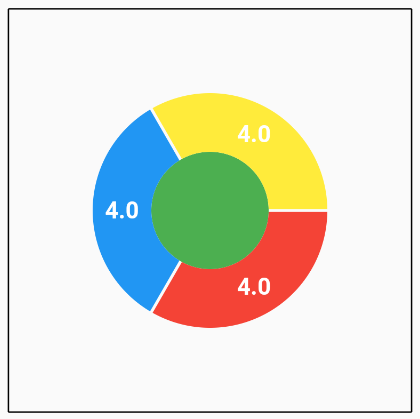
Adjust the center circle using the centerSpaceRadius and centerSpaceColor fields.
PieChart(
  PieChartData(
      centerSpaceRadius: 40,
      centerSpaceColor: Colors.green,
      sections: [
    PieChartSectionData(color: Colors.red, value: 4),
    PieChartSectionData(color: Colors.blue, value: 4),
    PieChartSectionData(color: Colors.yellow, value: 4),
  ]),
)
The border around the chart can be adjusted using the borderData field which takes an FlBorderData type value.
PieChart(
  PieChartData(
      sectionsSpace: 16,
      borderData: FlBorderData(
          border: Border.all(
        color: Colors.purple,
        width: 8,
      )),
      centerSpaceRadius: 40,
      centerSpaceColor: Colors.green,
      sections: [
        PieChartSectionData(color: Colors.red, value: 4),
        PieChartSectionData(color: Colors.blue, value: 4),
        PieChartSectionData(color: Colors.yellow, value: 4),
      ]),
)
Sweet Pie Slices
The individual pie slices are also highly customizable. You can change the color, radius, and title super easily.
PieChartSectionData(
    color: Colors.red,
    value: 4,
    radius: 70,
    showTitle: true,
    title: 'Cows',
    titlePositionPercentageOffset: .5,),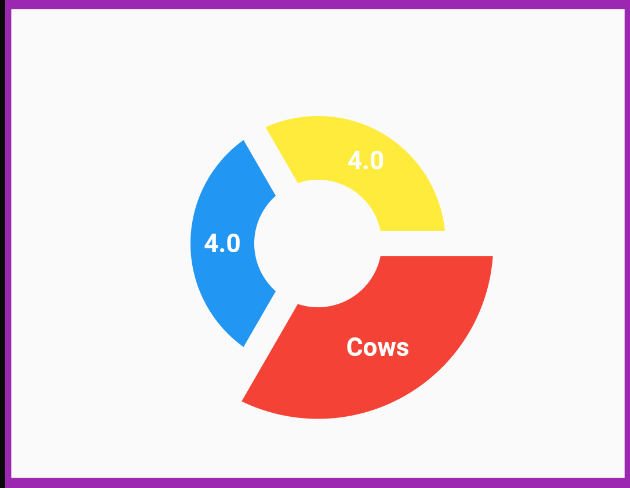
If a title is provided, it will be displayed instead of the slice's value. You can adjust where the title/value is placed on the slice by specifying a titlePositionPercentafeOffset. A value of 0.5 places the title in the center of the slice. 0 puts the title towards the center of the graph, and 1 puts it at the most outer edge.
You can also display a badge widget on the slices as long as all slices have a badge. In other words, if at least one slice does not have a badge, no badges will be displayed.
PieChartSectionData(
    color: Colors.red,
    value: 4,
    radius: 70,
    title: 'Moo',
    badgeWidget: Container(
      width: 20,
      height: 20,
      child: FlutterLogo(),
    ),
    badgePositionPercentageOffset: .98)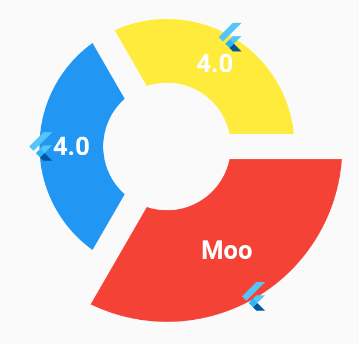
These badges can be positioned at different points along the pie's radius using the badgePositionPercentageOffset value.
Touch the Pie
Each piece of the pie can respond to touch input and you can handle the input using the pieTouchdata field. The touchCallback function will be called onPressDown and onPressUp so you'll need to make sure to handle it appropriately.
pieTouchData: PieTouchData(
  enabled: true,
  touchCallback: (PieTouchResponse response) {
    if (response.touchedSectionIndex != null) {
      print('Index: ' + response.touchedSectionIndex.toString());
      print('Value: ' + response.touchedSection.value.toString());
      print('Angle: ' + response.touchAngle.toString());
      print('Radius: ' + response.touchRadius.toString());
      print('Offset: ' + response.touchInput.getOffset().toString());
    }
  },
),
The PieTouchResponse object contains a ton of information about the touch event as you can see in the diagram below. The callback is only called when a pie slice is tapped and not when any other part of the chart area is touched.
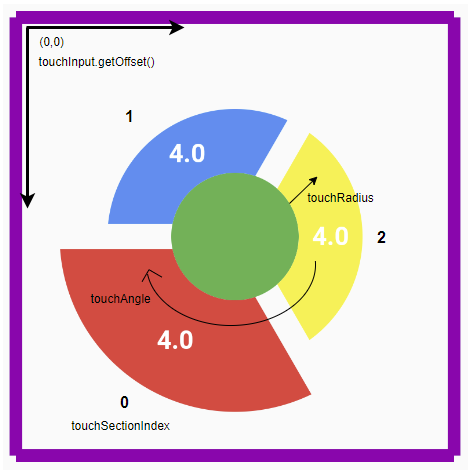
In addition to the positional data, the PieTouchResponse class also gives you access to all of the data from the PieChartSectionData through the touchedSection property (literally all of the values from above - title, value, radius, color, the badge widget, and the title/badge offset doubles).
Animate the Pie
The cool thing is that every chart in the fl_chart package is an ImplicitlyAnimatedWidget. This means that changes to it's properties are animated and we can demonstrate this by updating the startDegreeOffset on a button press.
The official documentation can be found here.


Comments